Favia Investment Group | Market Insights
Santa Monica Multifamily Market Update 2026: Cap Rates, Sales Trends & What Owners Need to Know
By Don Favia | Updated July 2, 2026
https://www.faviainvestmentgroup.com/market-insights/santa-monica-multifamily-market-update-2026
This is for general informational purposes only. Market data reflects conditions as of March 2026 and is subject to change. Consult with your CPA, tax advisor, and/or attorney for guidance specific to your situation.
The Santa Monica apartment market is shifting. If you own a multifamily property on the Westside, the next 12 months could look very different from the last two years.
This market update covers Q1 2026 conditions — cap rates, transaction volume, rent trends, and what buyers are actually underwriting right now. We update this report as new data comes in. Here is what is actually happening on the ground and what it means for your building.
As a Santa Monica multifamily specialist, we track these trends daily.
Where Cap Rates Stand Right Now
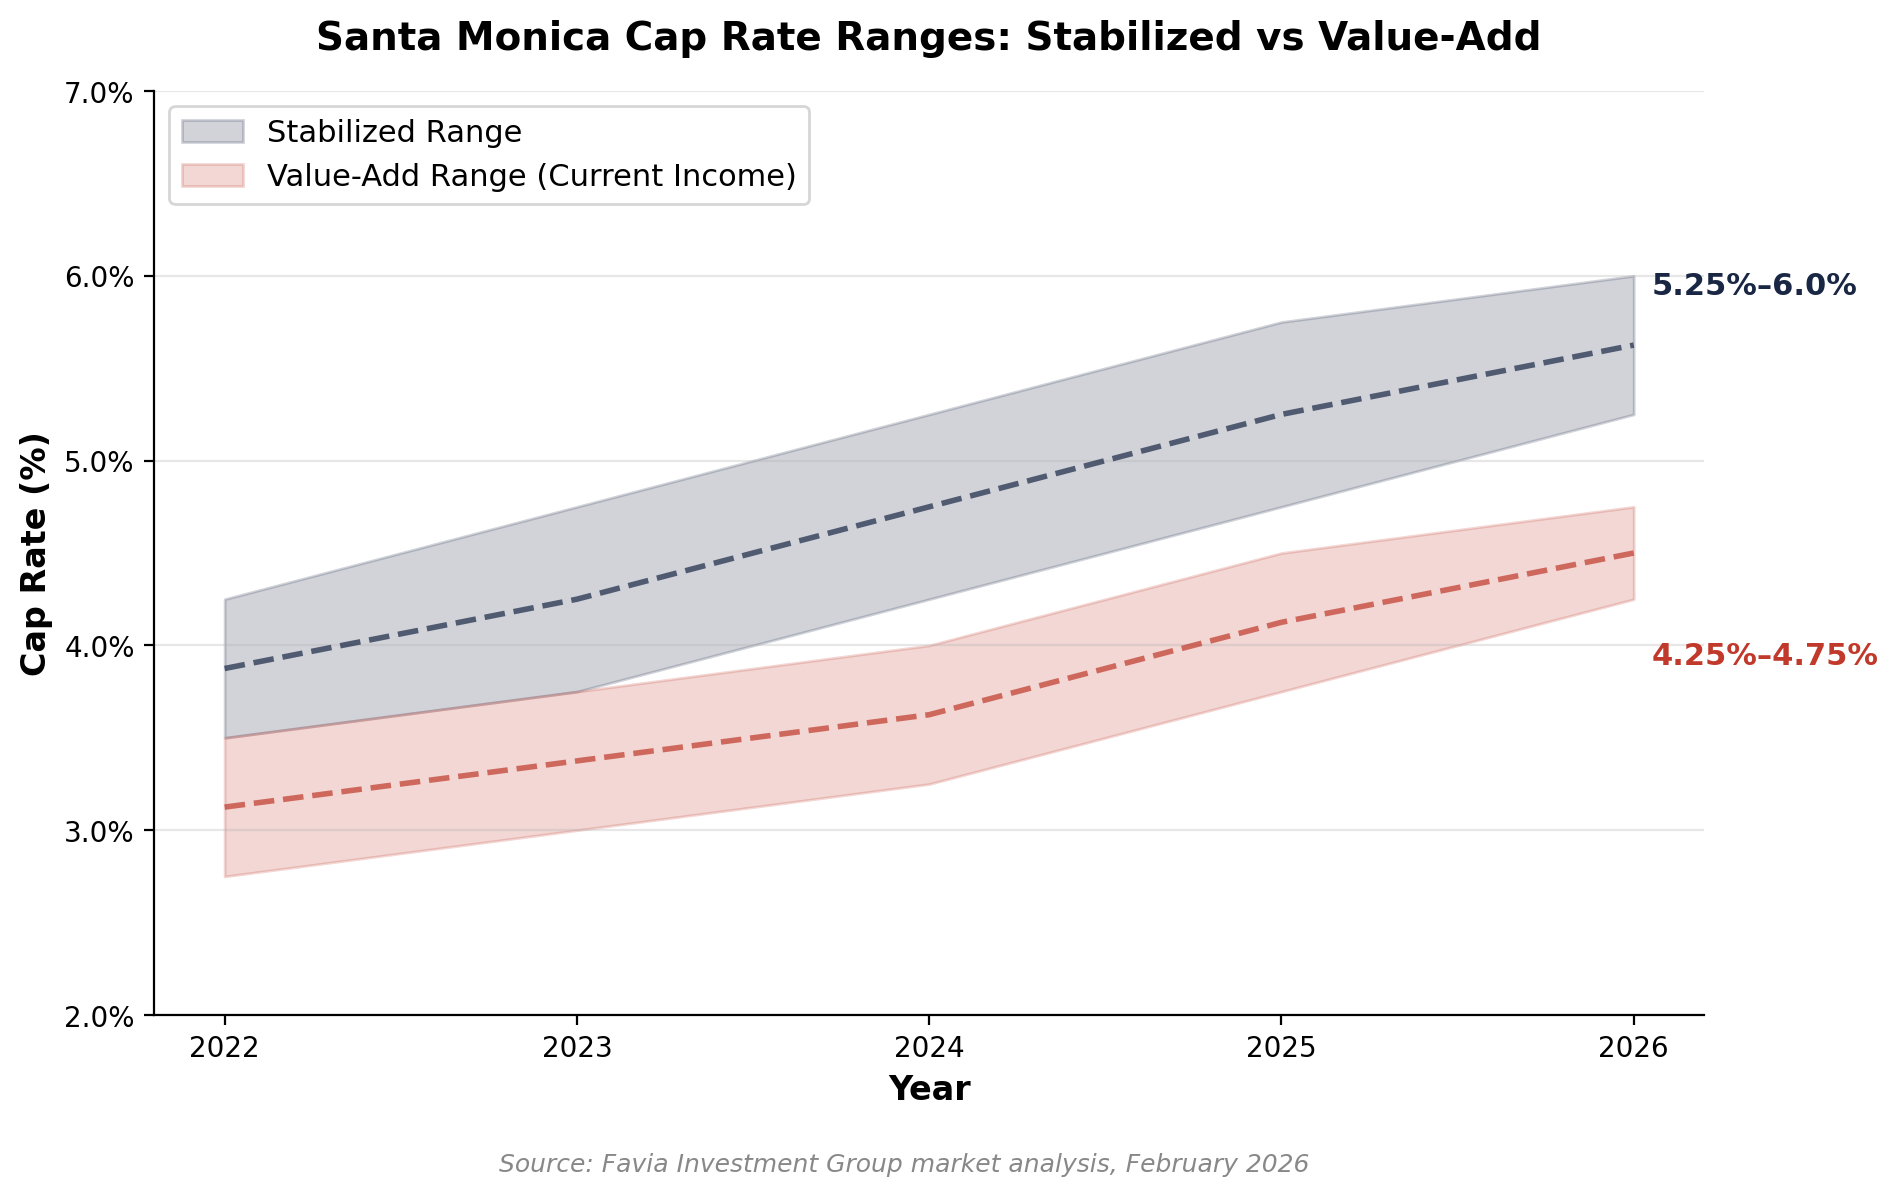
Santa Monica has always traded at a premium. That has not changed. But the spread between fully stabilized buildings and value add opportunities has widened significantly since 2022.
Santa Monica's average cap rates have historically sat around 3.5%, among the lowest in Los Angeles and the nation.* But that number reflects a different market. Nationally, multifamily cap rates have held flat at 5.7% for seven consecutive quarters, the longest stretch of unchanged cap rates in 25 years.* Santa Monica has always traded well below the national average due to its coastal location and supply constraints.
Based on recent transactions we are tracking in Santa Monica, fully stabilized properties are trading at cap rates between 5.25% and 6%, depending on how fully stabilized the asset is. A completely stabilized property with rents at market, no deferred maintenance, and no further upside can command closer to 6%. Buyers pay a premium on a per unit and per foot basis for these assets, but the strong NOI supports a healthy return from day one.
Value add buildings (below market rents, deferred maintenance, room for improvement) are trading at lower cap rates, typically 4.25% to 4.75% on current income for moderate value add opportunities. Why would a buyer accept a lower return? Because the current rents do not reflect the building's potential. The bet is straightforward: invest in renovations, push rents to market, and the cap rate on your purchase price climbs well above what you could have gotten buying stabilized. The work creates the return.
That is why value add remains the most active segment of the Santa Monica market right now. Buyers are not just purchasing a building. They are purchasing the gap between current rents and market rents, and in Santa Monica that gap can be significant.
For context on how pricing has shifted overall, a 10 unit building that would have sold at a sub 4% cap rate two years ago is now trading closer to 5%. The math has changed across the board.
Compare these numbers to our Q4 2024 Westside cap rate analysis.
Sales Volume Is Picking Up
After a historically slow 2023 and early 2024, transaction volume in Santa Monica started climbing in mid 2025. Multifamily sales activity in Santa Monica over the past year reached $628 million on a dollar basis, well above recent historical levels. Average pricing per unit sits at $680,000, compared to a metro average of $420,000.*
Why the pickup? A few things are converging:
The debt maturity wall is real. Approximately $875 billion in commercial and multifamily mortgage debt is coming due in 2026.* Multifamily maturities specifically are surging 56% to $162 billion this year.* Owners who took out floating rate bridge loans in 2021 and 2022 are facing resets. Some can refinance. Others cannot, especially if their debt service coverage ratios are underwater. That is creating motivated sellers.
Buyer sentiment has improved. Slight reductions in long term interest rates have made borrowing more favorable. More investors, especially institutional buyers, are deploying capital even at today's pricing levels.*
1031 exchange buyers are active. Investors selling in other markets are looking to park capital in coastal assets. Santa Monica remains a top destination for exchange buyers seeking long term appreciation.
The submarket story is not only cap rates and buyer profiles. Downtown Santa Monica is also trying to repair the street-level demand engine around the Promenade. I covered that newer angle in Santa Monica's downtown reset and what it means for multifamily buyers.
Rent Control Updates That Affect Your Bottom Line
If you own an RSO building in Santa Monica, you already know rent increases are tightly regulated. But 2026 brought changes worth paying attention to.
Santa Monica's unique rent control framework continues to shape investment strategy.
The Santa Monica Rent Control Board set the 2025 general adjustment at just 2.3%, with a maximum $60 increase per unit.* For the period from June 2025 through June 2026, allowable annual increases are capped at 3%.*
Meanwhile, the LA City RSO formula was also reduced. With the current LA CPI at 3%, the rent increase as of July 2026 would be only 2.9% for RSO units.*
This matters for valuation. A buyer underwriting your building is projecting future rent growth. When allowable increases are compressed, the growth story slows down, and that can affect what someone is willing to pay.
On the other hand, market rate units in Santa Monica continue to perform well relative to the broader LA market. While median rents across the LA metro dropped to a four year low of $2,167 in December 2025,* Santa Monica remains a premium submarket. Average asking rents in Santa Monica sit at $3,653 per month as of early 2026,* with two bedroom units averaging around $3,500.* Vacancy rates remain tight. The gap between controlled rents and market rents continues to widen, which creates significant upside when units turn over.
What Buyers Are Looking For
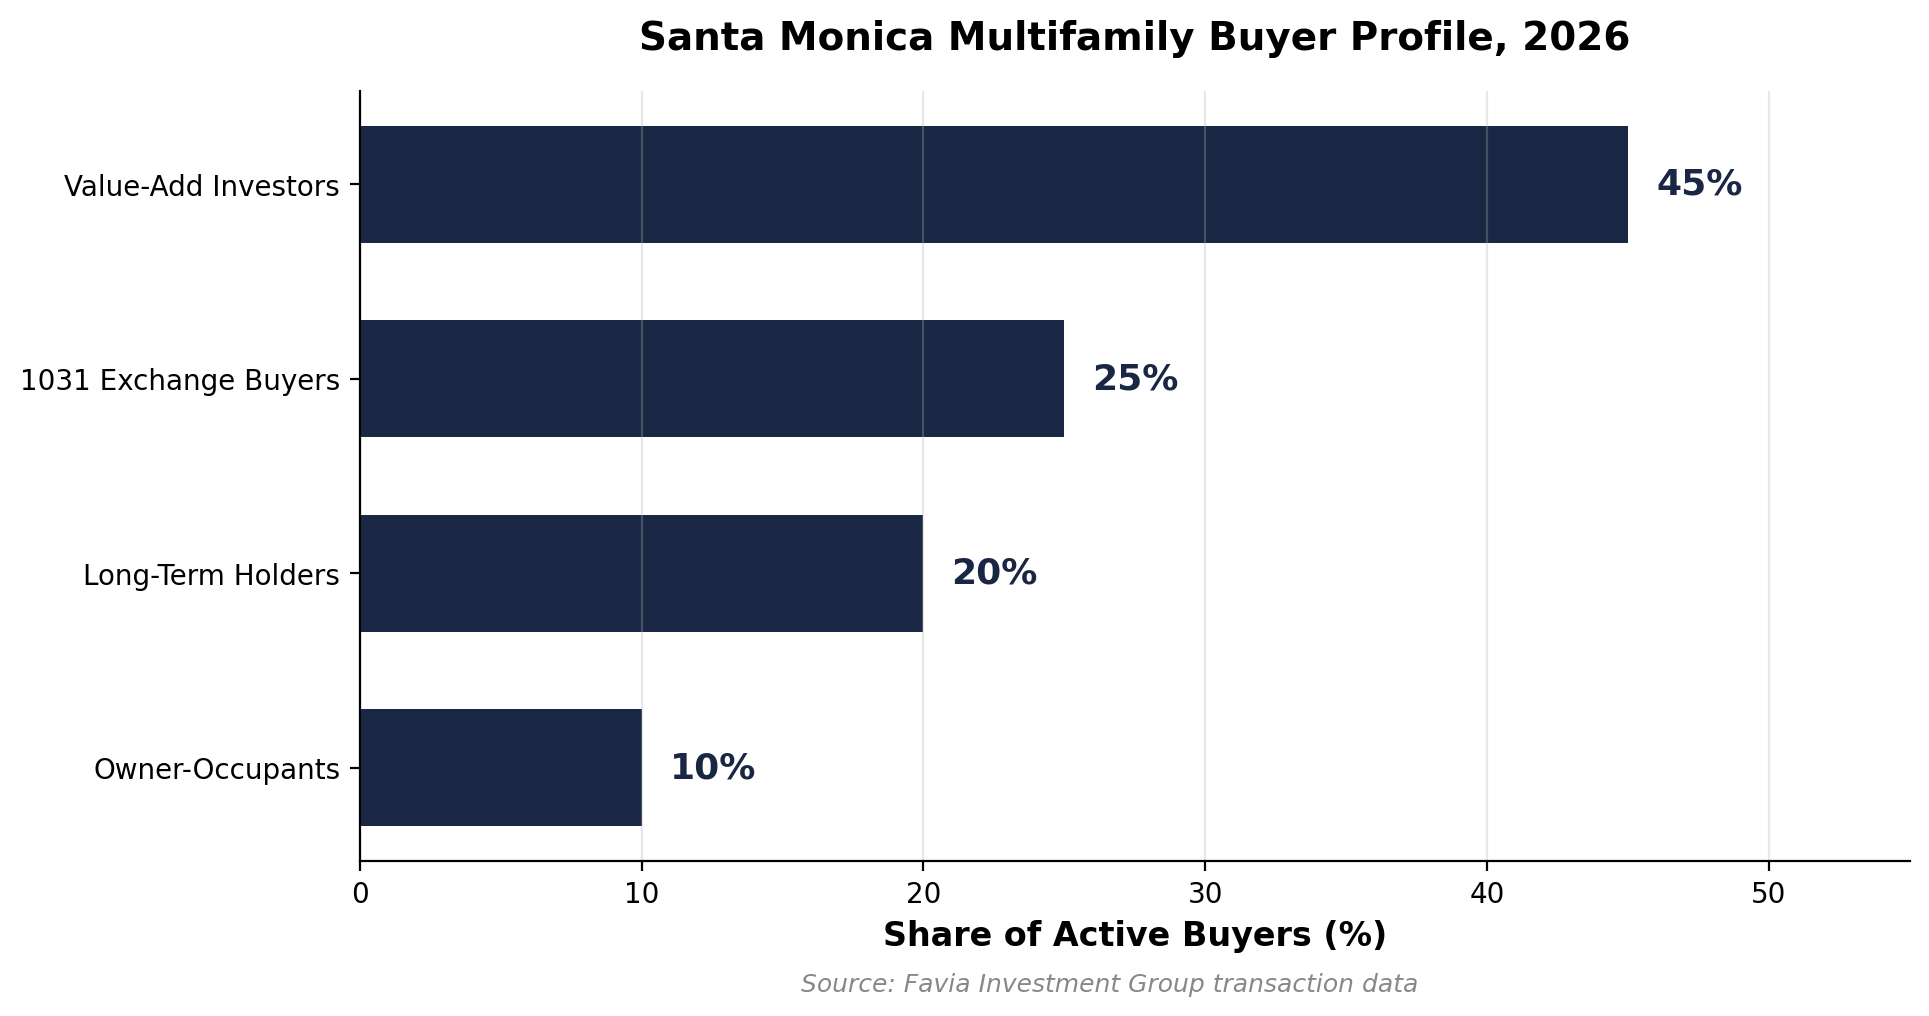
The buyer pool in Santa Monica has shifted. Here is who is active right now:
Value add investors are the most aggressive buyers. They want buildings with below market rents, deferred maintenance, and room to push income through unit renovations. These buyers are underwriting to a stabilized cap rate and working backward to their purchase price.
Long term holders are looking for buildings with stable cash flow in prime locations. They are less focused on current yield and more focused on 10 to 20 year appreciation. Santa Monica's supply constraints make it attractive for this strategy.
1031 exchange buyers often need to close within a specific timeline. This creates opportunities for sellers who can offer clean deals with minimal contingencies. Exchange buyers are sometimes willing to pay a slight premium for certainty of close.
The Neighborhoods Within Santa Monica
Not all of Santa Monica trades the same. Here is a quick breakdown of what we are seeing by area:
North of Montana remains the most expensive submarket. Smaller 2 to 4 unit properties trade at GRMs above 16, and buyer demand is consistently strong. These are generational hold properties.
Mid City (between Wilshire and Montana) offers the widest range of product. 8 to 20 unit buildings are the sweet spot here, and cap rates vary widely depending on condition and rent roll. This is where most of the value add activity is concentrated.
South of Pico has seen the most price correction. Buildings here that traded at sub 4% cap rates in 2022 are now available at 5% or better. For buyers with a longer time horizon, this area offers compelling entry points.
Ocean Park continues to attract owner occupants and small investors. The proximity to the beach commands a premium, but the building stock is older and often requires significant capital investment.
Santa Monica vs. the LA Metro: How the Numbers Compare
Context matters when you are evaluating your building. Here is how Santa Monica stacks up against the broader LA multifamily market as of Q1 2026:
| Metric | Santa Monica | LA Metro Avg |
|---|---|---|
| Avg Price Per Unit | $680,000 | $420,000 |
| Cap Rate Range (Stabilized) | 5.25% to 6.0% | 5.5% to 6.5% |
| Avg Asking Rent | $3,653/mo | $2,167/mo |
| GRM Range | 11.0 to 14.5 | 9.0 to 12.0 |
The premium is real and it is durable. Santa Monica trades at a 62% premium to the metro average on a per unit basis because the fundamentals support it: coastal location, supply constrained market, strong tenant demand, and a long track record of outperforming broader LA on appreciation. That premium compresses when sellers misprice into the old market. It holds when they price into the current one.
What the Market Is Actually Saying: Two Buildings on 6th Street
Two buildings. Same street in Santa Monica. Same submarket. Very different outcomes.
1117 6th Street is a 27-unit building north of Wilshire. It hit the market in August 2025 at $12.4 million. That implied a cap rate around 4.6% and a GRM of 13.2. The seller was pricing into 2023, maybe early 2024.
The market did not bite. First reduction came in November: down to $11.8 million. Then another in February 2026 to $10.995 million. That puts it at a 5.19% cap, GRM of 11.72, $407,000 per unit. The building is still on the market. Over 200 days and counting. Total price reduction: $1.405 million, or 11.3% off the original ask.
Every month that property sits, the seller pays carrying costs. There is a hidden cost too: the psychological discount buyers attach to stale listings. Once a building passes the six month mark, buyers start wondering what is wrong with it. Even if the issue was just price, the stigma sticks. That shifts leverage hard in the buyer's favor during negotiation.
Now look at 1042 6th Street. A 16-unit building on the same street. Listed March 11, 2026 at $4.45 million. Cap rate of 5.32%, GRM of 10.8, $278,000 per unit. This seller priced into where the market actually is right now. The listing has been live for about a week and from what we are hearing in the market, buyers are paying attention. That is what tends to happen when a seller prices where the market actually is.
Same street. Same buyer pool. One seller chased the market down for seven months and is still sitting. The other accepted current conditions and priced to move. The difference is not location or building quality. It is pricing discipline.
The cost of mispricing goes beyond the eventual lower sale price. It is months of debt service, property tax, insurance, and maintenance. It is the stigma of a stale listing that makes buyers hesitate. If you are thinking about selling, the lesson is simple: price into the market you have, not the one you wish you had.
What This Means If You Are Thinking About Selling
If you have been on the fence, here is the honest assessment:
Pricing has adjusted but stabilized. The worst of the repricing happened in 2023 and 2024. Analysis suggests multifamily cap rates may compress slightly in 2026, meaning values could tick back up for well positioned assets.*
Buyer demand is real. This is not 2021 where every listing got 15 offers. But qualified, motivated buyers are actively looking for Santa Monica multifamily. Good buildings are selling within 60 to 90 days.
The tax clock matters. If you are considering a 1031 exchange, you need to plan your timeline carefully. Identifying replacement properties within 45 days and closing within 180 days requires preparation. Your CPA or tax advisor can help you evaluate whether an exchange makes sense for your situation.
Deferred maintenance is a bigger discount than it used to be. Buyers in this market are pricing capital expenditures aggressively. A building that needs a new roof and plumbing is going to see a larger haircut than it would have in a seller's market. If you can address major items before listing, you will likely net more on the sale.
March 2026 Market Update: What Has Changed
This post was originally published in February 2026. Here is what the market update looks like as of mid-March:
Transaction volume has continued to build through Q1. The debt maturity pressure we flagged in February is now actively pushing more listings to market — several owners who were on the fence in January have started conversations about timing a sale before their loan maturities force the issue. The buyer pool remains active, particularly for clean deals with strong rent rolls.
Cap rates have held in the ranges noted above. No meaningful compression yet, but no further expansion either. The stabilization we anticipated appears to be materializing. Buyers are underwriting carefully but they are underwriting — this is not a frozen market.
Insurance continues to be the wildcard most owners underestimate. We are seeing it come up in buyer due diligence more than any prior period. If you have not run your renewal numbers recently, do it before you go to market.
Looking Ahead: The Rest of 2026
Here is what I am watching for the remainder of the year:
Interest rates and a new wildcard. Going into 2026, the consensus was a continued rate cut cycle, looser financing, and a tailwind for multifamily. That picture has shifted over the last few weeks. The escalation in the Middle East was not on anyone's 2026 forecast. Conflict in that region puts upward pressure on oil. Oil feeds inflation. Inflation ties the Fed's hands. We have already seen the 10 year Treasury tick up noticeably since the situation developed. A prolonged conflict likely means the rate cut cycle stalls. If inflation resurfaces, we could be looking at rate increases instead of cuts. 2026 was supposed to be a financing tailwind year. Right now, anyone underwriting around continued rate relief needs to stress test those assumptions.
Santa Monica City Council. Any new regulations around rent control, Ellis Act restrictions, or development incentives could affect owner decisions. We are monitoring proposed ordinances closely.
Insurance costs. Property insurance premiums in California have been rising sharply, with some owners seeing double or triple their previous rates at renewal.* Nationwide, multifamily property values have declined by 3.6% since 2019 partly due to rising insurance costs.* This is a real drag on NOI and something every owner needs to factor into their hold versus sell analysis.
Construction costs. If you are considering a value add play on a building you own, renovation costs remain elevated. Construction costs in Los Angeles average $200 to $650+ per square foot depending on scope.* For a moderate unit refresh (new kitchen, bath, flooring, paint) in Santa Monica, plan for $50,000 to $80,000 per unit. A full gut renovation can run $100,000 or more per unit.
The Santa Monica multifamily market is not what it was in 2021. But for owners who understand the current dynamics, there are clear paths forward, whether that means holding, repositioning, or selling into a market with active buyer demand.
If you own a multifamily property in Santa Monica and want to understand what it is worth in today's market, I am happy to run a confidential analysis. Call me at 424-377-6002 or email dfavia@riacre.com.
Want to know where your building stands? Request a complimentary broker opinion of value.
If you own a rent-controlled building in Santa Monica, see our detailed breakdown of what owners need to know before selling a rent-controlled apartment in 2026.
Frequently Asked Questions: Santa Monica Multifamily Market 2026
What are cap rates in Santa Monica multifamily right now?
As of Q1 2026, fully stabilized Santa Monica multifamily buildings are trading at cap rates between 5.25% and 6.0%. Value add buildings with below-market rents and renovation upside are trading at 4.25% to 4.75% on current income. These ranges have expanded roughly 75 to 100 basis points from where Santa Monica was trading in 2022. GRMs across the submarket range from 11.0 to 14.5 depending on location, unit mix, and rent roll quality.
Is 2026 a good time to sell a multifamily building in Santa Monica?
For well-priced buildings, yes. Buyer demand is active, particularly from 1031 exchange buyers and long-term private investors. The key word is well-priced. Buildings priced to where the market was in 2022 or 2023 are sitting. Buildings priced to Q1 2026 market conditions are trading within 60 to 90 days. Work with your broker to establish current value, not aspirational value. Consult your CPA on timing and tax strategy before listing.
How does Santa Monica multifamily compare to the LA metro average?
Santa Monica consistently trades at a significant premium to the LA metro average. Average price per unit in Santa Monica is approximately $680,000 versus $420,000 across the broader LA metro, a 62% premium. Average asking rents of $3,653 per month are roughly 69% above the metro median of $2,167. Cap rates in Santa Monica run tighter than most LA submarkets because of the coastal location, supply constraints, and long-term appreciation track record.
Sources
Matthews Real Estate, "Multifamily Market Report: Santa Monica, CA" — matthews.com
First American, "Multifamily Cap Rates Poised to Slip in 2026" — blog.firstam.com
Mortgage Bankers Association via Bloomberg, "Property Debt's Maturity Wall Eases as $875 Billion Comes Due," February 2026
RealCapAnalytics, "The 2026 Maturity Wall: A Quantitative Framework" — realcapanalytics.com
CBRE/Freddie Mac Q3 2025 Multifamily Cap Rate Report via Apartment Loan Store — apartmentloanstore.com
Santa Monica Rent Control Board, "Maximum Lawful Rent" — santamonica.gov
KeyBox Properties, "15 Facts Rental Property Owners Should Know in Santa Monica," February 2026
KeyBox Properties, "Major Announcement: RSO Rent Increase Formula Reduced," February 2026
Los Angeles Times, "'Finally, a Renter's Market': L.A. Rent Prices Drop to Four-Year Low," January 2026
RentCafe, "Average Rent in Santa Monica, CA: 2026 Rent Prices" — rentcafe.com
Apartments.com, "Rent Market Trends: Santa Monica, CA" — apartments.com
Federal Reserve Economic Data (FRED), "10-Year Treasury Constant Maturity Rate" — fred.stlouisfed.org
CoverageCat, "California's Home Insurance Crisis: Premiums Skyrocket in 2025" — coveragecat.com
Matthews Real Estate, "Rising Multifamily Insurance Costs in 2025" — matthews.com
JDJ Consulting, "Los Angeles Construction Cost 2025: Complete Updated Guide" — jdj-consulting.com