Favia Investment Group | Market Insights
Westside Multifamily Cap Rates in 2026: What Owners and Buyers Need to Know
By Don Favia | Updated March 11, 2026
https://www.faviainvestmentgroup.com/market-insights/westside-multifamily-cap-rates-2026
This market report is for informational purposes only and does not constitute investment, tax, or legal advice.
A lot of owners are still carrying a number in their head from 2021. That number is wrong. And it's costing them: either by sitting on the market too long, or by leaving the table before they had to.
Cap rates on the Westside have moved 130 to 150 basis points since 2022 and they are still moving. Not dramatically, not overnight. But the direction is clear. This is an expanding cap rate environment, not a compressing one. Anyone telling you otherwise is selling something.
I've been trading West LA multifamily for nearly 20 years and have closed over $370M across 100+ deals. Here's where the market actually stands in early 2026, submarket by submarket.
Where Cap Rates Are Right Now
These are closed deal numbers, not asking prices:
- Santa Monica — Stabilized: 5.5–5.75% | Value-add: 4.75–5.25%
- Brentwood — 5.0–5.5%
- West LA — 5.5–5.75%
- Mar Vista — 5.75–6.0%+
- Westwood — 5.0–5.5%
GRMs are running 11.0 to 14.5 depending on the submarket, unit mix, and rent control exposure. The low end of that range is Mar Vista value-add. The high end is Santa Monica or Brentwood with below-market rents and a patient buyer.
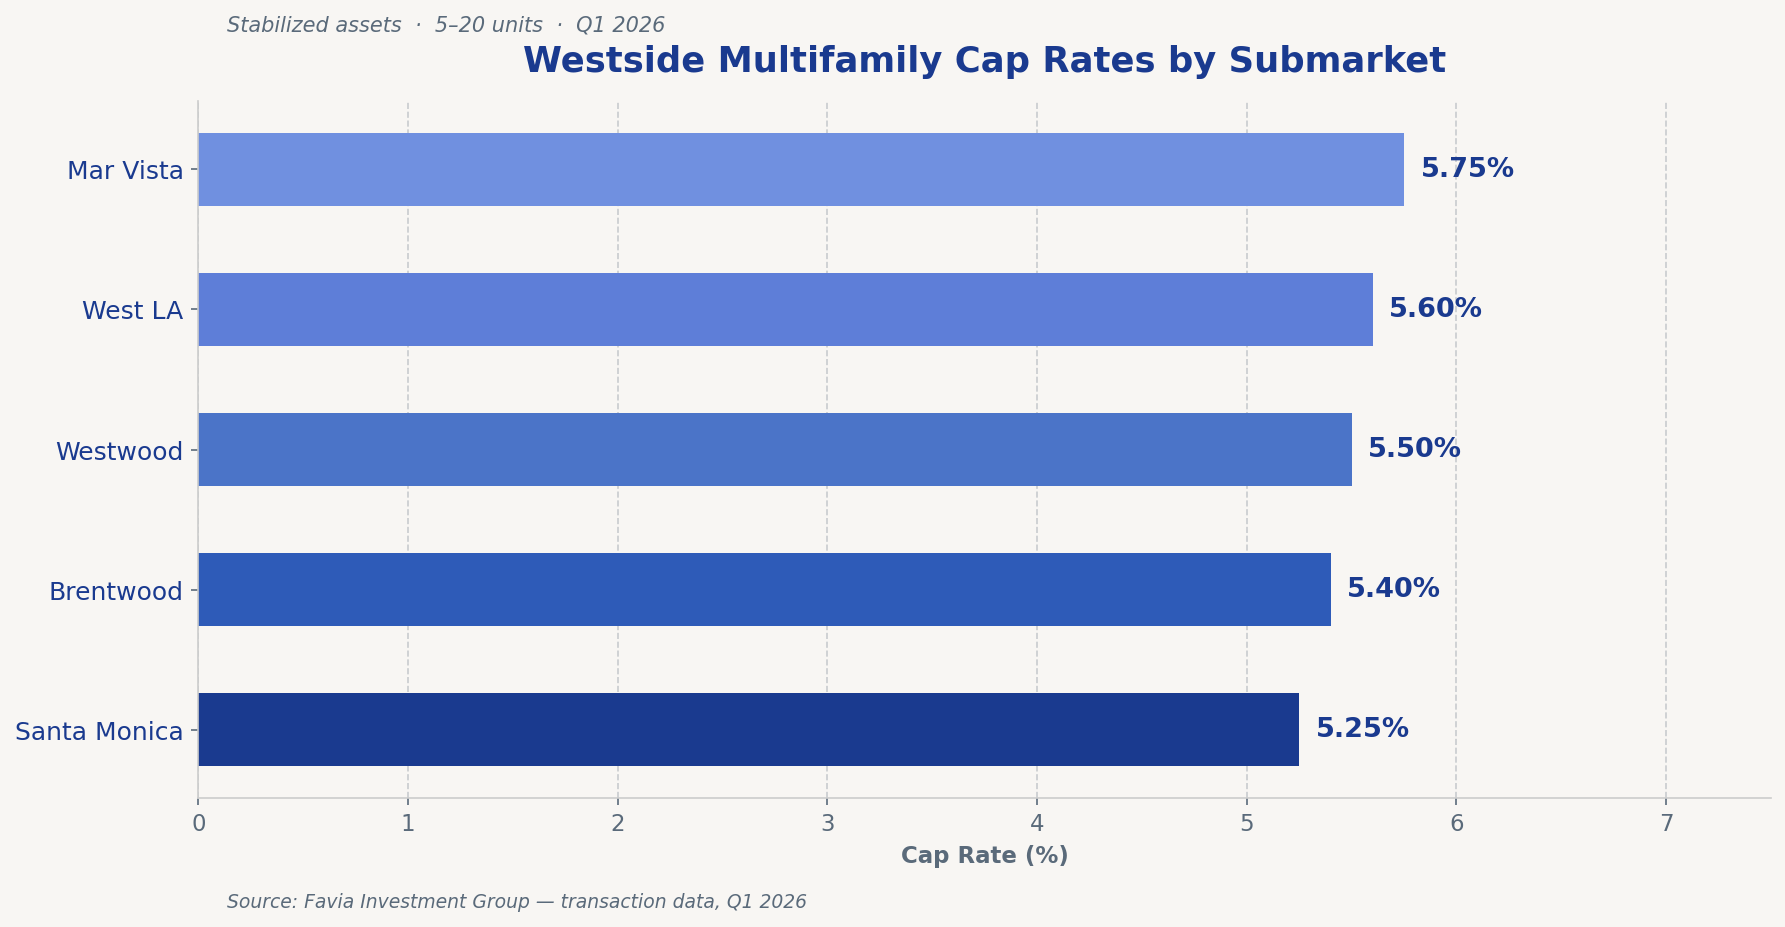
These numbers are consistent with broader LA County market reporting: average multifamily cap rates moved higher again in Q4 2025, continuing the expansion trend that began after 2022. The Westside tracks slightly tighter than the county average in the premium submarkets, wider in the value-add ones.
How We Got Here
In 2022, the average closed cap rate on rent-controlled LA multifamily was roughly 4.25%. That's not ancient history. That was three years ago.
Since then, cap rates have expanded 80 to 130 basis points depending on the submarket and asset type. The reasons are straightforward: the cost of debt went up, buyers had to demand more yield to make deals work, and sellers who wouldn't adjust sat on the market until they did.
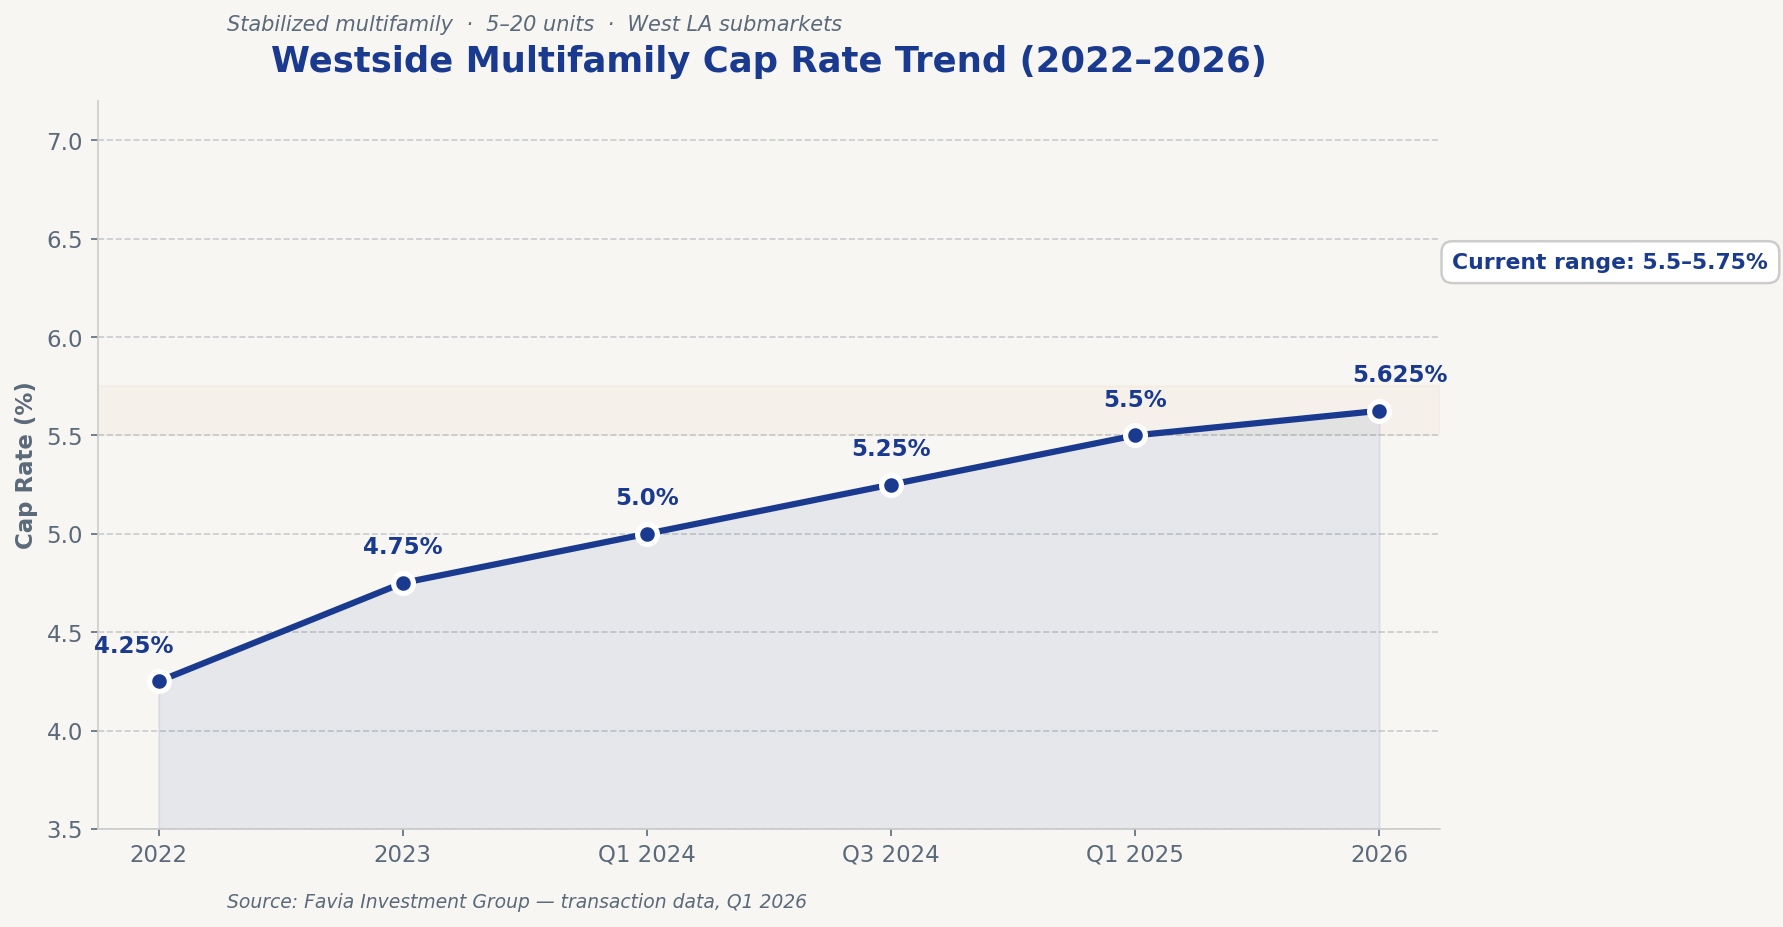
The pace of expansion has moderated. We're not seeing the sharp jumps of 2023. But the direction has not reversed. If you are underwriting a purchase or a sale today with the assumption that cap rates are heading back toward 4%, you need to revisit that model. There is no data supporting it.
For context on where we were heading into this year, see our Q4 2024 recap.
What's Actually Driving the Market
Rent Control
It's probably the most underestimated variable in Westside pricing. Santa Monica has some of the strictest local rent control in the state. Annual increases capped, vacancy decontrol limited, with layers of local ordinances on top of AB 1482. That compresses NOI upside and keeps cap rates tighter in one sense (less risk of income disruption) but also limits how fast you can grow into a deal.
West LA operates mostly under statewide AB 1482, which is less restrictive. More headroom on rents, more buyer flexibility. If you own in Santa Monica and want to understand exactly how rent control affects your valuation, our Santa Monica Rent Control Guide breaks it down.
Debt Maturity
A meaningful volume of loans from 2021 and 2022 are coming due in 2026. Owners who locked in cheap floating-rate debt are now staring at a refi environment that doesn't work at their basis. Some are selling because they have to. That creates motivated sellers, and motivated sellers price to close.
This is showing up in deal flow. The transaction volume across LA County grew in 2025. Nearly 30,000 units traded — partly because owners who had been holding on finally came to terms with where the market is.
1031 Demand
Exchange buyers keep the Westside from cracking. They have deadlines, they have equity, and they will pay a premium over what a cash buyer running a strict yield analysis would pay. Santa Monica and Brentwood in the $3M to $8M range are especially active for 1031 buyers because the inventory is limited and the quality is consistent.
This is a real force. It doesn't offset the cap rate expansion trend, but it does create a floor under the premium submarkets.
Submarket by Submarket
The Westside's five core submarkets trade very differently from each other. Here's the honest picture on each.
Santa Monica
Stabilized assets are trading at 5.5 to 5.75%. Value-add situations (buildings with below-market rents, vacant units, or upside through turnover) compress into the 4.75 to 5.25% range because buyers are pricing in future rent recovery.
Per-unit pricing on the Westside's premium assets runs from $350K to $500K+ depending on location and quality. North of Montana, Wilmont, and Ocean Park command the highest prices. Buildings in the $2.5M to $3.6M range with clean financials are moving in under 60 days right now. Larger assets above $5M are slower unless there's a clear value-add story.
Brentwood
Tighter than people expect, at 5.0 to 5.5%. Lower rent control exposure than Santa Monica, high-income tenants, and a buyer pool that skews toward long-term holders. Most of the stock here is 4 to 12 units from the 1950s and 1960s. When a building trades in Brentwood, there's usually a story behind it: estate, partnership dissolution, something that motivated the sale. Buyers know that and compete accordingly.
West LA
The workhorse submarket. Cap rates of 5.5 to 5.75%, consistent deal flow, and the broadest buyer pool on the Westside. Institutional buyers, syndicators, 1031 buyers, and private investors all show up here. The diversity of demand keeps pricing stable. If you want to transact, West LA moves.
Mar Vista
The value-add market. Cap rates of 5.75 to 6.0% and higher reflect the neighborhood's transition. Gentrification is real east of Venice Boulevard, the older stock west of Grand View still needs work. Buyers who know the streets are finding deals. Buyers who don't are overpaying for the story.
Westwood
UCLA and the medical center anchor demand here. Tenants are stable, turnover is moderate, and pricing reflects that: 5.0 to 5.5% cap rates. Rent growth is modest but predictable. The closer to campus, the more the location premium overrides everything else.
What This Means If You're an Owner
The market is not broken. But it has repriced. The owner who bought a 12-unit in West LA in 2021 at a 4.25% cap and put floating-rate debt on it is in a different position than the owner who bought the same building in 2018 and has had time to grow the rent roll.
If you're thinking about selling, the question isn't whether cap rates are expanding. They are. The question is whether your specific building's income has grown fast enough to offset the cap rate move. In some cases it has, especially in buildings with meaningful turnover since 2022. In others, it hasn't.
The only way to know is to run the actual numbers on your rent roll. If you want to know where your building sits today, request a confidential BOV. I'll give you a real number based on where comparable deals are closing right now, not a range so wide it's useless.
What This Means If You're a Buyer
Expanding cap rates are actually good news if you're buying. A 5.6% cap with 30% down at today's debt pricing can generate real cash-on-cash returns in a way that a 4.25% cap in 2021 never could.
The risk is assuming rates reverse quickly. Don't underwrite to cap rate compression as your exit. Underwrite to rent growth, debt paydown, and the long-term scarcity of Westside multifamily. Those fundamentals haven't changed. The pricing reset has just made them more accessible.
The Bottom Line
Cap rates are expanding. That is the defining fact of this market right now. Not "may expand," not "have expanded and stabilized" but are expanding, present tense, with no reversal in sight.
For sellers, that means pricing to today, not 2021. For buyers, it means the deals that pencil today are better than anything that penciled three years ago. For everyone, it means doing the math on your specific building rather than relying on a market number that may or may not apply to your situation.
If you want to talk through where your building fits, call me at 424-377-6002 or email dfavia@riacre.com. No pitch, no obligation. Just the number.
This is for general informational purposes only. Consult with your CPA, tax advisor, and/or attorney for guidance specific to your situation.